How To Guides
Save figure
To save a pliffy plot, we have to specify a minimum of three things in PliffyInfoABD:
plot_name
save
save_path
For example:
>>> from pliffy import PliffyInfoABD, plot_abd
>>> import random
>>> random.seed(42)
>>> data = [random.random() * 100 for _ in range(60)]
>>> data_a = data[:30]
>>> data_b = data[30:]
>>> info = PliffyInfoABD(data_a=data_a,
                         data_b=data_b,
                         plot_name='great_figure',
                         save=True,
                         save_path='/home/martin/Desktop/'
                         )
>>> plot_abd(info)
This will save our pliffy plot with the name great_figure.png to the specified folder. The plot is saved as a png at a dpi=180 because these are the default values.
These can easily be changed:
>>> info = PliffyInfoABD(data_a=data_a,
                         data_b=data_b,
                         plot_name='great_figure',
                         save=True,
                         save_path='/home/martin/Desktop/',
                         dpi=300,
                         save_type='png',
                         )
>>> plot_abd(info)
Alternatively, we may want to save our plot to a vector-based format, like svg or pdf. This too is possible with pliffy.
>>> info_pdf = PliffyInfoABD(data_a=data_a,
                          data_b=data_b,
                          plot_name='great_figure_pdf',
                          save=True,
                          save_path='/home/martin/Desktop/',
                          save_type='pdf',
                          )
>>> plot_abd(info_pdf)
>>> info_svg = PliffyInfoABD(data_a=data_a,
                          data_b=data_b,
                          plot_name='great_figure_svg',
                          save=True,
                          save_path='/home/martin/Desktop/',
                          save_type='svg',
                          )
>>> plot_abd(info_svg)
Add pliffy plots as subplots to a figure
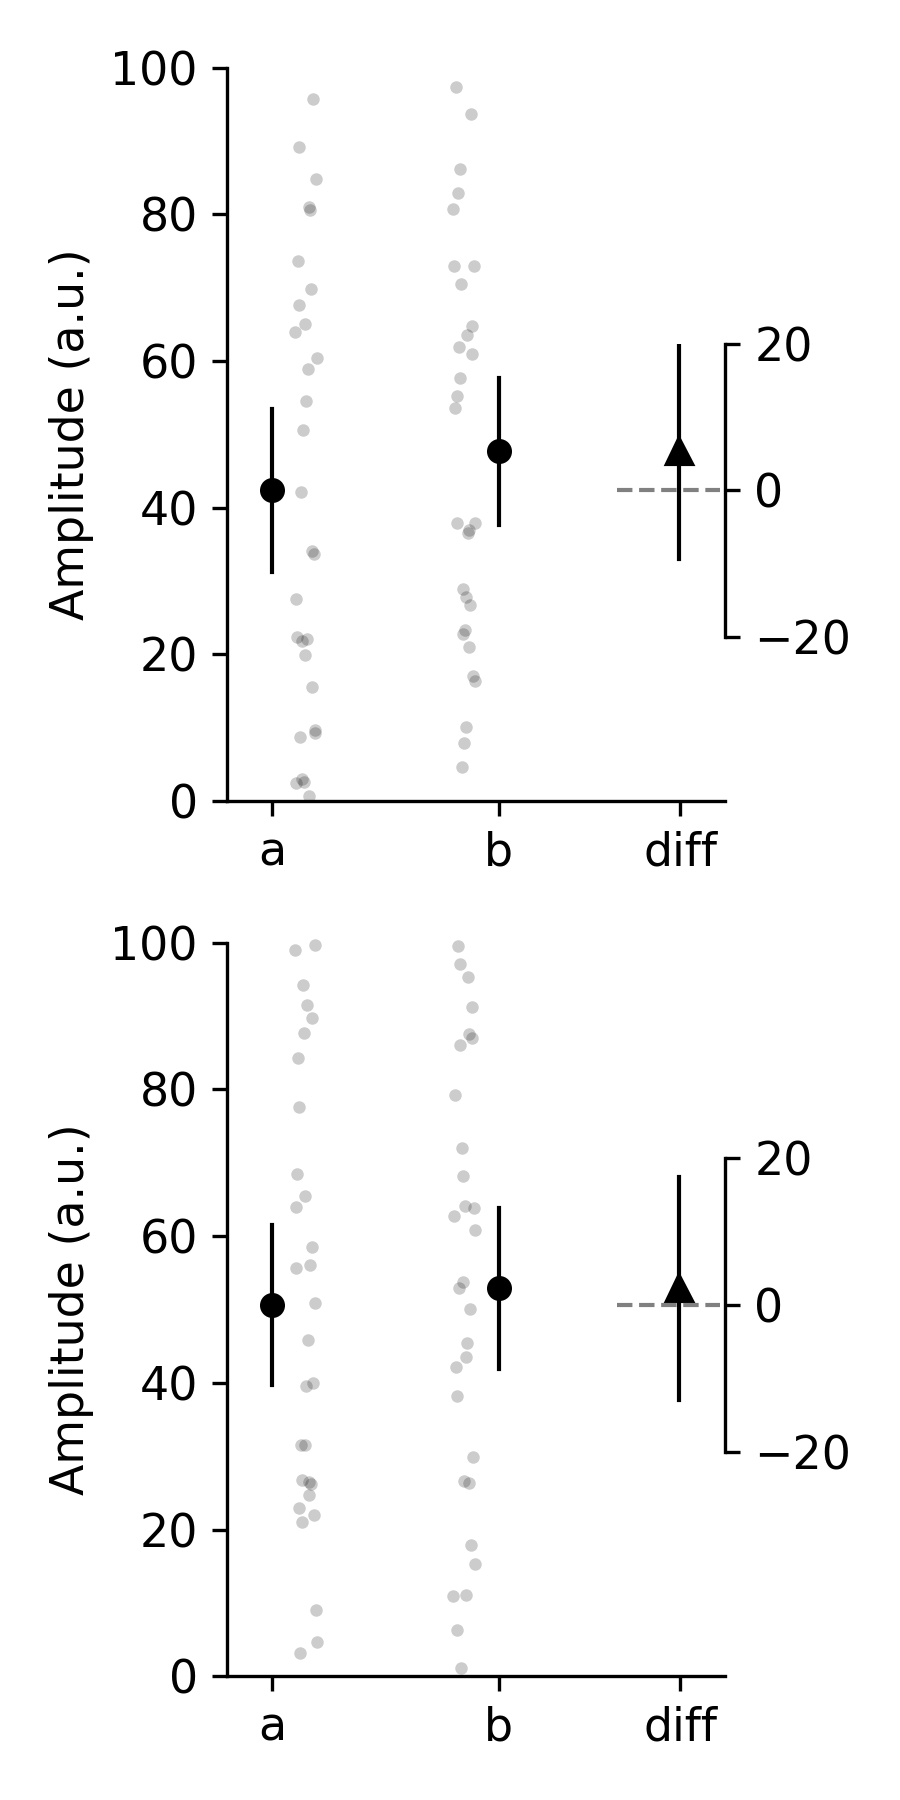
Thus far we have generated pliffy plots on their own. However, by passing a matplotlib axis object to the plot_abd function, we can create a pliffy plot on a pre-existing figure.
for example, this is useful if we want to create a pair of related pliffy plots, one on top of the other, for a one-column figure in the paper we are about to submit.
>>> from pliffy import PliffyInfoABD, plot_abd
>>> import random
>>> random.seed(42)
# Generate random data for first subplot
>>> data = [random.random() * 100 for _ in range(60)]
>>> data_a = data[:30]
>>> data_b = data[30:]
# Create figure
>>> fig, axes = plt.subplots(ncols=2, figsize=(3, 6))
# Create info for first subplot, and plot (note show=False)
>>> info1 = PliffyInfoABD(data_a=data_a, data_b=data_b,  show=False)
>>> plot_abd(info1, axes[0])
# Generate random data for second subplot
>>> data = [random.random() * 100 for _ in range(60)]
>>> data_a = data[:30]
>>> data_b = data[30:]
# Create info for second subplot, and plot (note show=True)
>>> info2 = PliffyInfoABD(data_a=data_a, data_b=data_b,  show=True)
>>> plot_abd(info2, axes[1])
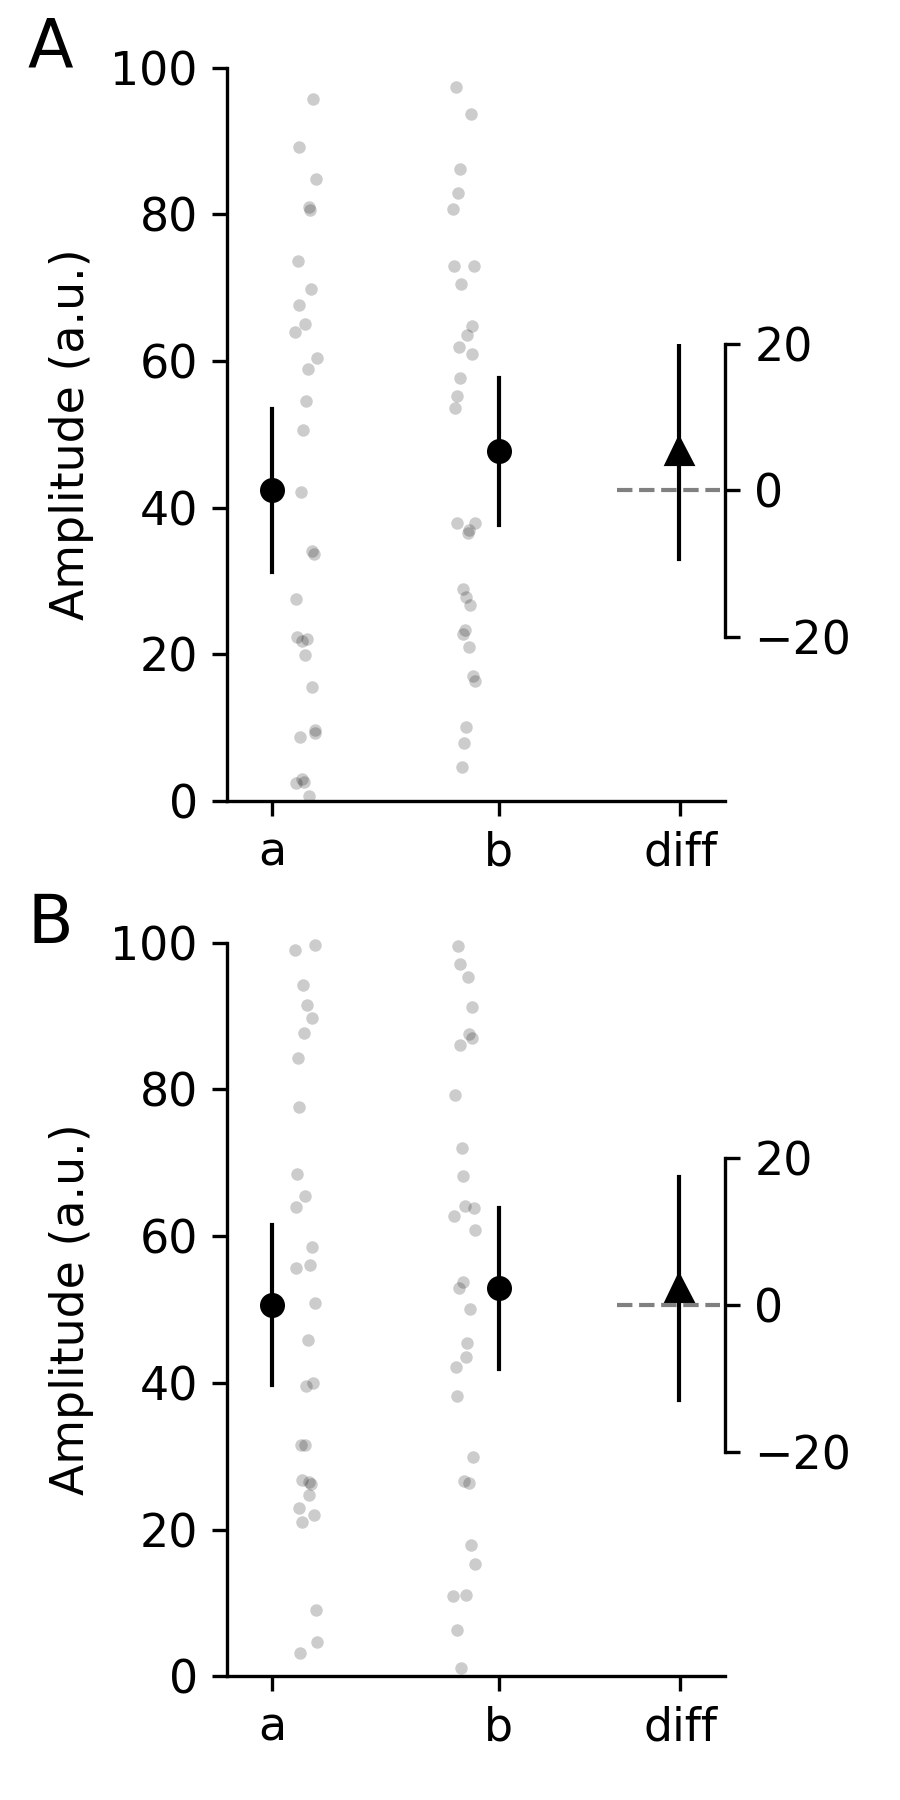
That looks pretty good. But what if we want to prepare a publication-quality figure? All that is missing (other than actual data and axes labels!) are the letters to reference to our subplots. This can easily be added with matplotlib.
>>> import matplotlib.pyplot as plt
>>> for ax, letter in zip(axes, ('A', 'B')):
        ax.text(-0.4, 1, letter, fontsize=16, transform=ax.transAxes)
Run the pliffy test suite
In order to run the pliffy test suite, you will have to get the full pliffy from GitHub. You will also need to ensure you have the various requirements need to run pliffy, pytest, and the pytest-mpl plugin for pytest. All these packages and plugins are available on Pypi can can be installed using pip.
pytest-mpl is a plugin that can be used to test figures that are generated with matplotlib.
To run the full suite of tests, run the following command from the root directory of the pliffy package:
$ pytest --mpl
Add tests to pliffy
If you have added some features to pliffy, please add tests that cover the new code.
All test file are located in the tests folder in the root directory of the pliffy package.
If your new feature was added to an existing module, please add your tests to the file named test_<module_name>.py. For example, if you added something to the utils.py module, your test(s) should go in test_utils.py.
Any new fixtures can be added to the conftest.py file.
If your test generates a new figure, please follow the instructions in the README.md file of pytest-mpl. Briefly, create a test that generates a figure and return it. In most cases, you will need to return plt.gcf(). For example, here is the first test from test_figure_diff.py:
@pytest.mark.mpl_image_compare(
    savefig_kwargs={"dpi": 600}, baseline_dir=str(Path(".") / "baseline")
)
def test_example1(pliffy_info_example1):
    plot_abd(pliffy_info_example1)
    return plt.gcf()
After adding your new test, you will need to run the following command:
$ pytest --mpl-generate-path=tests/baseline
This assumes you are running this command from the root directory of the pliffy package. It will generate and save the figure in the baseline directory. This is where all reference figures used to test pliffy are stored.